Ejemplos de la API REST v2 en Postman
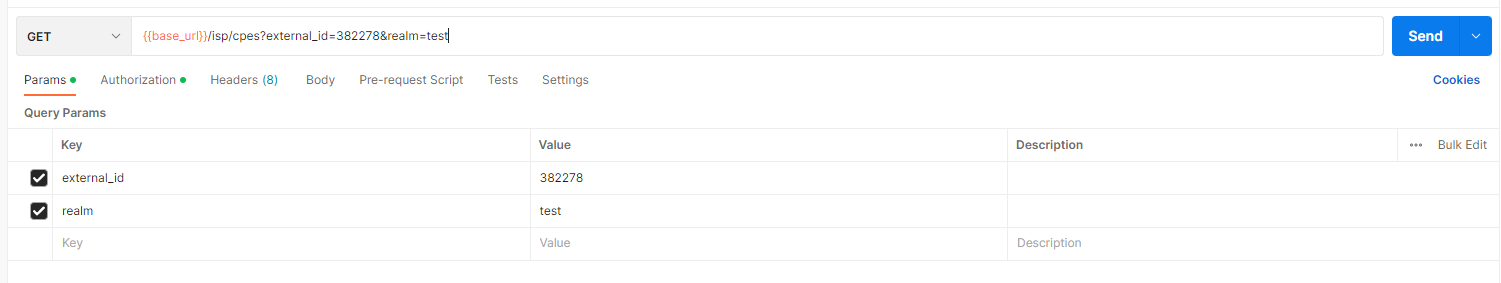
Consultar un cpe por su external_id y obtener su id
Método: GET
URL: /api/v2/isp/cpes/?external_id={external_id}&realm={realm}
Los parámetros: external_id, realm, son opcionales y nos permiten acotar la lista de resultados. Es decir, si ponemos solamente el valor del realm, obtendremos un listado paginado con todos los CPEs de ese Realm.
Respuesta (Ejemplo: /api/v2/isp/cpes/?external_id=pim0585&realm=pim)):
{
  "count": 1,
  "next": null,
  "previous": null,
  "results": [
    {
      "id": 585,
      "access": true,
      "address": "",
      "active": true,
      "address_profile": "public",
      "bridge": false,
      "city": "",
      "country": "",
      "cpename": "pim0585",
      "created": "2023-02-08T10:53:20+01:00",
      "customer": 848,
      "disable_provision": false,
      "disable_reconfig": false,
      "expiration_date": null,
      "dsn": null,
      "enable_notifications": false,
      "external_id": "pim0585",
      "external_voip": false,
      "fixed_address": null,
      "has_tr069": true,
      "internal_id": "pim0585",
      "latitude": "38.0124867",
      "line_profile": "residential",
      "locality": "",
      "longitude": "-1.1699524",
      "mac": null,
      "model": "HS8145V",
      "mtamac": null,
      "notes": "",
      "postalcode": null,
      "probe": false,
      "pppoe_password": "",
      "pppoe_username": "",
      "profile": 8,
      "realm": "pim",
      "remote_id": null,
      "sn": "48575443614711a7",
      "tech": "gpon",
      "tech_updated": "2023-02-17T11:11:19+01:00",
      "topology": "",
      "tv_profile": null,
      "updated": "2023-02-17T11:11:19+01:00",
      "voip_profile": null,
      "wanmac": null,
      "me_vlan": null,
      "lan_cidr": null,
      "wifi_password": "",
      "wifi_profile": null,
      "wifi_ssid": "",
      "_links": {
        "actions": {
          "reboot": "/api/v2/isp/cpes/585/reboot",
          "unprovision": "/api/v2/isp/cpes/585/unprovision",
          "reprovision": "/api/v2/isp/cpes/585/reprovision",
          "factory": "/api/v2/isp/cpes/585/factory",
          "reconfig": "/api/v2/isp/cpes/585/reconfig",
          "diagnostic": "/api/v2/isp/cpes/585/cwmp_diagnostic"
        },
        "links": {
          "customer": "/api/v2/isp/cpes/585/customer",
          "profile": "/api/v2/isp/cpes/585/profile",
          "model": "/api/v2/isp/cpes/585/model",
          "potses": "/api/v2/isp/cpes/585/potses",
          "events": "/api/v2/isp/cpes/585/events",
          "cdrs": "/api/v2/isp/cpes/585/events?type=cdr",
          "logs": "/api/v2/isp/cpes/585/logs",
          "livestatus": "/api/v2/isp/cpes/585/livestatus",
          "links": "/api/v2/isp/cpes/585/links",
          "info": "/api/v2/isp/cpes/585/info",
          "cwmp_info": "/api/v2/isp/cpes/585/cwmp_info"
        }
      },
      "_services": [
        "provision",
        "tr069",
        "dhcp",
        "txrx"
      ],
      "is_router": true,
      "avatar": "HG4101",
      "tr069": true
    }
  ]
}
Monitorización en tiempo real de un equipo
Método: GET
URL: /api/v2/monitoring/cpes/{id}/info
Nota: El campo id, se encuentra dentro de los atributos que devuelve la petición anterior.
Respuesta (Ejemplo: /api/v2/monitoring/cpes/585/info):
{
  "alarms": [
    {
      "level": "warning",
      "type": "processerror",
      "admin_status": "init",
      "name": "The GPON ONT configuration recovery fails",
      "extra": "effect=serviceaffect curr=0 prev=1"
    }
  ],
  "dnbw": 0,
  "ips": [
    "10.8.33.14"
  ],
  "output": "online oltHuawei:0/5/14-2 10.8.33.14",
  "registration": {
    "host": "oltHuawei",
    "id": "0/5/14-2",
    "last_down_time": null,
    "related_services": [
      "onug-olt0/05/14"
    ],
    "states": [
      "online"
    ],
    "tags": [
      "oltHuawei-0/5/14",
      "oltHuawei"
    ]
  },
  "services": {
    "txrx": {
      "output": "dnrx=-22.14 uptx=2.27 uprx=-12.71 dnatt=22.14 upatt=14.98 pondesv=0.00",
      "perfdatas": [
        {
          "items": [],
          "max": 5,
          "metric": "dnrx",
          "min": -49,
          "thresholds": [
            -29,
            -27,
            -11,
            -8
          ],
          "uom": "dBm",
          "value": -22.14
        },
        {
          "items": [],
          "max": 15,
          "metric": "uptx",
          "min": -10,
          "thresholds": [],
          "uom": "dBm",
          "value": 2.27
        },
        {
          "items": [],
          "max": 5,
          "metric": "uprx",
          "min": -49,
          "thresholds": [
            -32,
            -30,
            -12,
            -9
          ],
          "uom": "dBm",
          "value": -12.709999999999994
        },
        {
          "items": [],
          "max": 60,
          "metric": "upatt",
          "min": 1,
          "thresholds": [
            26,
            46
          ],
          "uom": "dB",
          "value": 14.979999999999993
        }
      ],
      "state_id": 0
    }
  },
  "state": "up",
  "state_id": 0,
  "tech": {
    "line_profile": "residential_krill",
    "service_ports": [
      {
        "id": 6038,
        "user_vlan": 1023,
        "service_vlan": 833,
        "outbound_traffic_table_name": "management",
        "inbound_traffic_table_name": "management",
        "native_vlan": 0
      },
      {
        "id": 6039,
        "user_vlan": 1021,
        "service_vlan": 831,
        "outbound_traffic_table_name": "100M",
        "inbound_traffic_table_name": "100M",
        "native_vlan": 1
      }
    ],
    "service_profile": "HG1000",
    "type_name": "110H"
  },
  "upbw": 0,
  "uptime": 14042
}

Obtener información de monitorización diferido
Método: GET
URL: /api/v2/monitoring/hosts/{internal_id}
Nota: El campo internal_id, se encuentra dentro de los atributos que devuelve la petición anterior.
Response (Ejemplo: /api/v2/monitoring/hosts/pim0585):
{
  "type": "Host",
  "name": "pim0585",
  "meta": {},
  "attrs": {
    "address": "",
    "host_name": "pim0585",
    "last_check": "2023-02-17T12:50:06.475000+01:00",
    "last_check_result": {
      "command": null,
      "output": "online oltHuawei:0/5/14-0 0.0.0.0",
      "state": 0,
      "execution_start": "2023-02-17T12:50:06.475000+01:00",
      "execution_time": 0,
      "execution_end": "2023-02-17T12:50:06.475000+01:00",
      "schedule_start": "2023-02-18T12:50:06.475000+01:00"
    },
    "next_check": "2023-02-18T12:50:06.475000+01:00",
    "output": "online oltHuawei:0/5/14-0 0.0.0.0",
    "service_name": "",
    "state": 0,
    "state_type": 1,
    "state_long": "up",
    "vars": {
      "vendor": "Huawei",
      "model": "HS8145V",
      "administrative_info": {
        "access": true,
        "actions": [
          "diagnostic",
          "factory",
          "reboot",
          "reconfig",
          "reprovision",
          "unprovision"
        ],
        "active": true,
        "address": " - ",
        "address_profile": "public",
        "customer_address": " - ",
        "customer_external_id": null,
        "customer_name": "Test INTERNET ",
        "external_voip": false,
        "id": 585,
        "latitude": 38.0124867,
        "line_profile": "residential",
        "longitude": -1.1699524,
        "model": "HS8145V",
        "potses": [],
        "profile_downstream": "1000M",
        "profile_name": "1G Simetricos",
        "profile_upstream": "1000M",
        "realm": "pim",
        "services": [
          "dhcp",
          "provision",
          "tr069",
          "txrx"
        ],
        "sn": "48575443614711a7",
        "tech": "gpon",
        "tr069": true,
        "vendor": "Huawei"
      },
      "type": "cpe",
      "cpe_registration_id": "0/5/14-0",
      "cpe_registration_host": "oltHuawei",
      "business_impact": 1,
      "cpe_registration_state": [
        "online"
      ],
      "search": " -   -  Test INTERNET  public 38.0124867 residential -1.1699524 HS8145V pim 48575443614711a7 gpon True Huawei ",
      "cpe_registration_tags": [
        "oltHuawei-0/5/14-0",
        "oltHuawei"
      ]
    }
  },
  "joins": {}
}

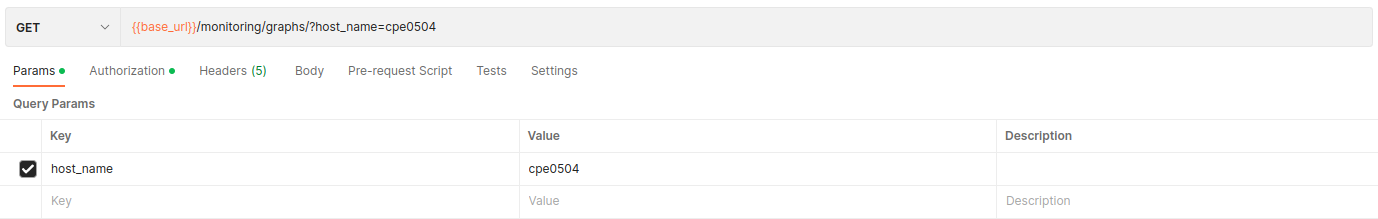
Obtener los tipos de gráficas de un host
Método: GET
URL: /api/v2/monitoring/graphs/?host_name={internal_id|host_name}
Nota: El campo internal_id, se encuentra dentro de los atributos que devuelve la petición anterior. También puede usarse el nombre del host en caso de ser un equipo de core.
Respuesta (Ejemplo: /api/v2/monitoring/graphs/?host_name=pim0585):
{
  "graphs": [
    {
      "group": "bandwidth",
      "severity": 0,
      "title": "Bandwidth",
      "type": "LineChart",
      "weight": 3,
      "range": "24h",
      "datasets": [
        {
          "label": "dnbw",
          "measurement": "check_cpe",
          "metric": "dnbw",
          "uom": "B",
          "min": null,
          "max": null,
          "warning": null,
          "critical": null,
          "error": null,
          "percentile": null,
          "operator": null,
          "color_index": 1
        },
        {
          "label": "upbw",
          "measurement": "check_cpe",
          "metric": "upbw",
          "uom": "B",
          "min": null,
          "max": null,
          "warning": null,
          "critical": null,
          "error": null,
          "percentile": null,
          "operator": null,
          "color_index": 2
        }
      ]
    }
  ]
}
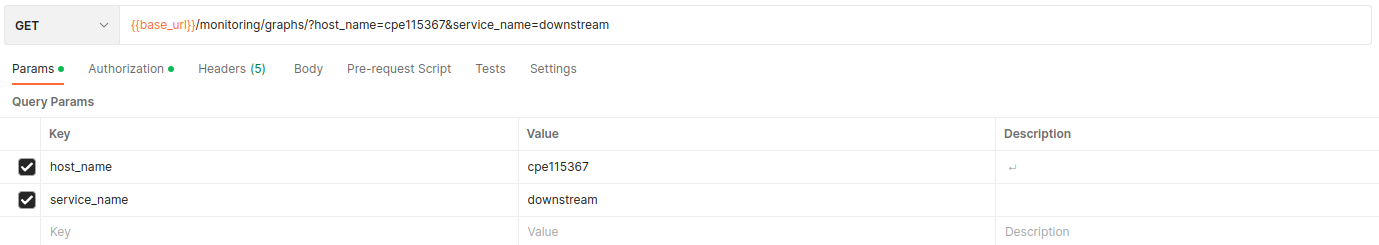
Obtener los tipos de gráficas de un servicio de un host
Método: GET
URL: /api/v2/monitoring/graphs/?host_name={internal_id|host_name}&service_name={service_name}
Nota: El campo internal_id, se encuentra dentro de los atributos que devuelve la petición anterior. También puede usarse el nombre del host en caso de ser un equipo de core.
Respuesta (Ejemplo: /api/v2/monitoring/graphs/?host_name=pim0585&service_name=txrx):
{
  "graphs": [
    {
      "group": "dnatt Graph.",
      "severity": 50,
      "title": "dnatt Graph.",
      "type": "LineChart",
      "weight": 1,
      "range": "24h",
      "datasets": [
        {
          "label": "dnatt",
          "measurement": "check_txrx",
          "metric": "dnatt",
          "uom": "null",
          "min": 1,
          "max": 1,
          "warning": 26,
          "critical": 46,
          "error": null,
          "percentile": null,
          "operator": null,
          "color_index": null
        }
      ]
    },
    {
      "group": "dnrx Graph.",
      "severity": 0,
      "title": "dnrx Graph.",
      "type": "LineChart",
      "weight": -2,
      "range": "24h",
      "datasets": [
        {
          "label": "dnrx",
          "measurement": "check_txrx",
          "metric": "dnrx",
          "uom": "null",
          "min": -49,
          "max": -49,
          "warning": -11,
          "critical": -8,
          "error": null,
          "percentile": null,
          "operator": null,
          "color_index": null
        }
      ]
    },
    {
      "group": "uptx Graph.",
      "severity": 0,
      "title": "uptx Graph.",
      "type": "LineChart",
      "weight": 0,
      "range": "24h",
      "datasets": [
        {
          "label": "uptx",
          "measurement": "check_txrx",
          "metric": "uptx",
          "uom": "null",
          "min": -10,
          "max": -10,
          "warning": 15,
          "critical": 16,
          "error": null,
          "percentile": null,
          "operator": null,
          "color_index": null
        }
      ]
    },
    {
      "group": "uprx Graph.",
      "severity": 0,
      "title": "uprx Graph.",
      "type": "LineChart",
      "weight": -1,
      "range": "24h",
      "datasets": [
        {
          "label": "uprx",
          "measurement": "check_txrx",
          "metric": "uprx",
          "uom": "null",
          "min": -49,
          "max": -49,
          "warning": -12,
          "critical": -9,
          "error": null,
          "percentile": null,
          "operator": null,
          "color_index": null
        }
      ]
    },
    {
      "group": "upatt Graph.",
      "severity": 0,
      "title": "upatt Graph.",
      "type": "LineChart",
      "weight": 1,
      "range": "24h",
      "datasets": [
        {
          "label": "upatt",
          "measurement": "check_txrx",
          "metric": "upatt",
          "uom": "null",
          "min": 1,
          "max": 1,
          "warning": 26,
          "critical": 46,
          "error": null,
          "percentile": null,
          "operator": null,
          "color_index": null
        }
      ]
    },
    {
      "group": "pondesv Graph.",
      "severity": 0,
      "title": "pondesv Graph.",
      "type": "LineChart",
      "weight": 0,
      "range": "24h",
      "datasets": [
        {
          "label": "pondesv",
          "measurement": "check_txrx",
          "metric": "pondesv",
          "uom": "null",
          "min": -10,
          "max": -10,
          "warning": 2,
          "critical": 4,
          "error": null,
          "percentile": null,
          "operator": null,
          "color_index": null
        }
      ]
    }
  ]
}
Obtención de métricas de una gráfica determinada en un periodo de tiempo
Para cada gráfica devuelta en el endpoint anterior, se puede peticionar las métricas dentro de un intervalo determinado de tiempo para los diferentes datasets.
Si para una gráfica existen varios datasets disponibles, éstos se podrán pedir de forma simultánea.
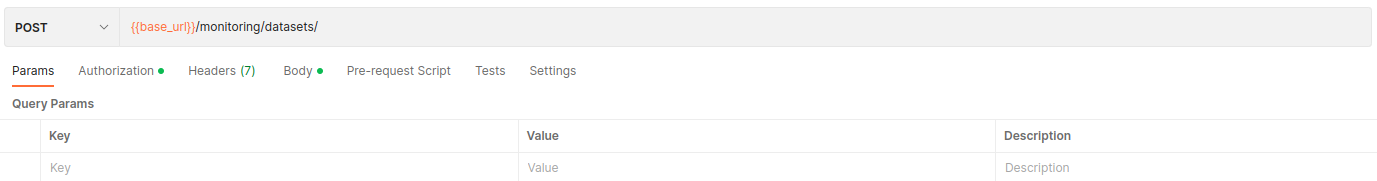
Método: POST
URL: /api/v2/monitoring/datasets/
Request:
{
  "host_name":"{internal_id|host_name}",
  "service_name":null|"service_name"
  "start":"{time_magnitude}",
  "end":"{time_magnitude}",
  "metrics":[
    {
      "host_name":"{internal_id|host_name}",
      "service_name":null|"{service_name}",
      "measurement":"{measurement}",
      "metric":"dnatt"
    }
  ],
}
time_magnitude: Valor compuesto de unidades y magnitud de tiempo, por ejemplo: 24h para las últimas 24 horas. Las magnitudes permitidas son: [m]minutos, [h]hora, [d]ías measurement: Extraído del array de datasets de la petición de gráficas. metric: Extraído del array de datasets de la petición de gráficas.
Request de ejemplo:
{
  "host_name":"pim0585",
  "service_name":"txrx"
  "start":"24h",
  "end":"0m",
  "metrics":[
    {
      "host_name":"pim0585",
      "service_name":"txrx",
      "measurement":"check_txrx",
      "metric":"dnatt"
    }
  ],
}
Respuesta:
{
  "check_txrx__pim0585__txrx__dnatt":[
    {
      "time":"2023-02-16T15:00:00Z",
      "value":29.03,
      "unit":null
    },
    {
      "time":"2023-02-16T19:00:00Z",
      "value":30.35,
      "unit":null
    },
    {
      "time":"2023-02-16T23:00:00Z",
      "value":30.21,
      "unit":null
    },
    {
      "time":"2023-02-17T03:00:00Z",
      "value":31.54,
      "unit":null
    },
    {
      "time":"2023-02-17T07:00:00Z",
      "value":31.52,
      "unit":null
    },
    {
      "time":"2023-02-17T11:00:00Z",
      "value":27.03,
      "unit":null
    }
  ]
}