Postman REST API v2 samples
Query cpe by its external_id and get its ID
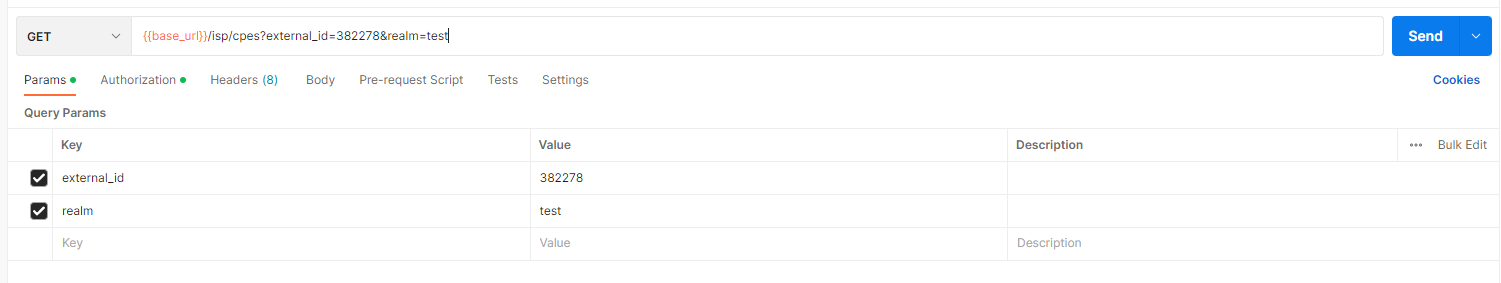
Method: GET
URL: /api/v2/isp/cpes/?external_id={external_id}&realm={realm}
external_id, realm parameters are optional and allow us to narrow down the list of results. That is, if we only put the value of the realm, we will obtain a paginated list with all the CPEs of that Realm.
Response (Sample: /api/v2/isp/cpes/?external_id=pim0585&realm=pim)):
{
  "count": 1,
  "next": null,
  "previous": null,
  "results": [
    {
      "id": 585,
      "access": true,
      "address": "",
      "active": true,
      "address_profile": "public",
      "bridge": false,
      "city": "",
      "country": "",
      "cpename": "pim0585",
      "created": "2023-02-08T10:53:20+01:00",
      "customer": 848,
      "disable_provision": false,
      "disable_reconfig": false,
      "expiration_date": null,
      "dsn": null,
      "enable_notifications": false,
      "external_id": "pim0585",
      "external_voip": false,
      "fixed_address": null,
      "has_tr069": true,
      "internal_id": "pim0585",
      "latitude": "38.0124867",
      "line_profile": "residential",
      "locality": "",
      "longitude": "-1.1699524",
      "mac": null,
      "model": "HS8145V",
      "mtamac": null,
      "notes": "",
      "postalcode": null,
      "probe": false,
      "pppoe_password": "",
      "pppoe_username": "",
      "profile": 8,
      "realm": "pim",
      "remote_id": null,
      "sn": "48575443614711a7",
      "tech": "gpon",
      "tech_updated": "2023-02-17T11:11:19+01:00",
      "topology": "",
      "tv_profile": null,
      "updated": "2023-02-17T11:11:19+01:00",
      "voip_profile": null,
      "wanmac": null,
      "me_vlan": null,
      "lan_cidr": null,
      "wifi_password": "",
      "wifi_profile": null,
      "wifi_ssid": "",
      "_links": {
        "actions": {
          "reboot": "/api/v2/isp/cpes/585/reboot",
          "unprovision": "/api/v2/isp/cpes/585/unprovision",
          "reprovision": "/api/v2/isp/cpes/585/reprovision",
          "factory": "/api/v2/isp/cpes/585/factory",
          "reconfig": "/api/v2/isp/cpes/585/reconfig",
          "diagnostic": "/api/v2/isp/cpes/585/cwmp_diagnostic"
        },
        "links": {
          "customer": "/api/v2/isp/cpes/585/customer",
          "profile": "/api/v2/isp/cpes/585/profile",
          "model": "/api/v2/isp/cpes/585/model",
          "potses": "/api/v2/isp/cpes/585/potses",
          "events": "/api/v2/isp/cpes/585/events",
          "cdrs": "/api/v2/isp/cpes/585/events?type=cdr",
          "logs": "/api/v2/isp/cpes/585/logs",
          "livestatus": "/api/v2/isp/cpes/585/livestatus",
          "links": "/api/v2/isp/cpes/585/links",
          "info": "/api/v2/isp/cpes/585/info",
          "cwmp_info": "/api/v2/isp/cpes/585/cwmp_info"
        }
      },
      "_services": [
        "provision",
        "tr069",
        "dhcp",
        "txrx"
      ],
      "is_router": true,
      "avatar": "HG4101",
      "tr069": true
    }
  ]
}
Monitoring host in real time
Method: GET
URL: /api/v2/monitoring/cpes/{id}/info
Note: The id field is found within the attributes returned by the previous request.
Response (Sample: /api/v2/monitoring/cpes/585/info):
{
  "alarms": [
    {
      "level": "warning",
      "type": "processerror",
      "admin_status": "init",
      "name": "The GPON ONT configuration recovery fails",
      "extra": "effect=serviceaffect curr=0 prev=1"
    }
  ],
  "dnbw": 0,
  "ips": [
    "10.8.33.14"
  ],
  "output": "online oltHuawei:0/5/14-2 10.8.33.14",
  "registration": {
    "host": "oltHuawei",
    "id": "0/5/14-2",
    "last_down_time": null,
    "related_services": [
      "onug-olt0/05/14"
    ],
    "states": [
      "online"
    ],
    "tags": [
      "oltHuawei-0/5/14",
      "oltHuawei"
    ]
  },
  "services": {
    "txrx": {
      "output": "dnrx=-22.14 uptx=2.27 uprx=-12.71 dnatt=22.14 upatt=14.98 pondesv=0.00",
      "perfdatas": [
        {
          "items": [],
          "max": 5,
          "metric": "dnrx",
          "min": -49,
          "thresholds": [
            -29,
            -27,
            -11,
            -8
          ],
          "uom": "dBm",
          "value": -22.14
        },
        {
          "items": [],
          "max": 15,
          "metric": "uptx",
          "min": -10,
          "thresholds": [],
          "uom": "dBm",
          "value": 2.27
        },
        {
          "items": [],
          "max": 5,
          "metric": "uprx",
          "min": -49,
          "thresholds": [
            -32,
            -30,
            -12,
            -9
          ],
          "uom": "dBm",
          "value": -12.709999999999994
        },
        {
          "items": [],
          "max": 60,
          "metric": "upatt",
          "min": 1,
          "thresholds": [
            26,
            46
          ],
          "uom": "dB",
          "value": 14.979999999999993
        }
      ],
      "state_id": 0
    }
  },
  "state": "up",
  "state_id": 0,
  "tech": {
    "line_profile": "residential_krill",
    "service_ports": [
      {
        "id": 6038,
        "user_vlan": 1023,
        "service_vlan": 833,
        "outbound_traffic_table_name": "management",
        "inbound_traffic_table_name": "management",
        "native_vlan": 0
      },
      {
        "id": 6039,
        "user_vlan": 1021,
        "service_vlan": 831,
        "outbound_traffic_table_name": "100M",
        "inbound_traffic_table_name": "100M",
        "native_vlan": 1
      }
    ],
    "service_profile": "HG1000",
    "type_name": "110H"
  },
  "upbw": 0,
  "uptime": 14042
}

Query deferred monitoring host info
Method: GET
URL: /api/v2/monitoring/hosts/{internal_id}
Note: The internal_id field is found within the attributes returned by the previous request.
Response (Sample: /api/v2/monitoring/hosts/pim0585):
{
  "type": "Host",
  "name": "pim0585",
  "meta": {},
  "attrs": {
    "address": "",
    "host_name": "pim0585",
    "last_check": "2023-02-17T12:50:06.475000+01:00",
    "last_check_result": {
      "command": null,
      "output": "online oltHuawei:0/5/14-0 0.0.0.0",
      "state": 0,
      "execution_start": "2023-02-17T12:50:06.475000+01:00",
      "execution_time": 0,
      "execution_end": "2023-02-17T12:50:06.475000+01:00",
      "schedule_start": "2023-02-18T12:50:06.475000+01:00"
    },
    "next_check": "2023-02-18T12:50:06.475000+01:00",
    "output": "online oltHuawei:0/5/14-0 0.0.0.0",
    "service_name": "",
    "state": 0,
    "state_type": 1,
    "state_long": "up",
    "vars": {
      "vendor": "Huawei",
      "model": "HS8145V",
      "administrative_info": {
        "access": true,
        "actions": [
          "diagnostic",
          "factory",
          "reboot",
          "reconfig",
          "reprovision",
          "unprovision"
        ],
        "active": true,
        "address": " - ",
        "address_profile": "public",
        "customer_address": " - ",
        "customer_external_id": null,
        "customer_name": "Test INTERNET ",
        "external_voip": false,
        "id": 585,
        "latitude": 38.0124867,
        "line_profile": "residential",
        "longitude": -1.1699524,
        "model": "HS8145V",
        "potses": [],
        "profile_downstream": "1000M",
        "profile_name": "1G Simetricos",
        "profile_upstream": "1000M",
        "realm": "pim",
        "services": [
          "dhcp",
          "provision",
          "tr069",
          "txrx"
        ],
        "sn": "48575443614711a7",
        "tech": "gpon",
        "tr069": true,
        "vendor": "Huawei"
      },
      "type": "cpe",
      "cpe_registration_id": "0/5/14-0",
      "cpe_registration_host": "oltHuawei",
      "business_impact": 1,
      "cpe_registration_state": [
        "online"
      ],
      "search": " -   -  Test INTERNET  public 38.0124867 residential -1.1699524 HS8145V pim 48575443614711a7 gpon True Huawei ",
      "cpe_registration_tags": [
        "oltHuawei-0/5/14-0",
        "oltHuawei"
      ]
    }
  },
  "joins": {}
}

Query host graphs types
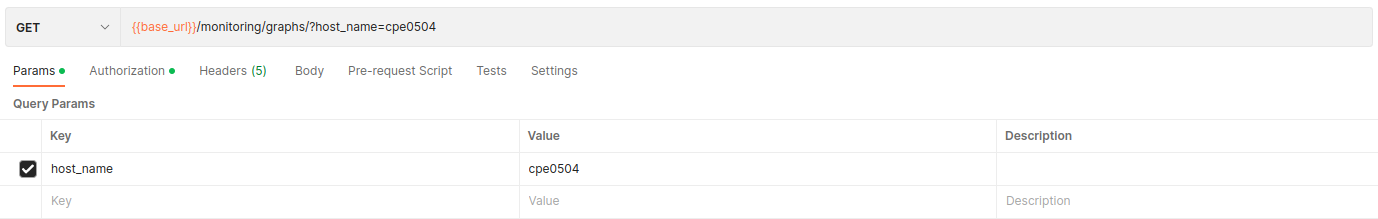
Method: GET
URL: /api/v2/monitoring/graphs/?host_name={internal_id|host_name}
Note: The internal_id field is found within the attributes returned by the previous request. The host name can also be used in case of being a core host.
Response (Sample: /api/v2/monitoring/graphs/?host_name=pim0585):
{
  "graphs": [
    {
      "group": "bandwidth",
      "severity": 0,
      "title": "Bandwidth",
      "type": "LineChart",
      "weight": 3,
      "range": "24h",
      "datasets": [
        {
          "label": "dnbw",
          "measurement": "check_cpe",
          "metric": "dnbw",
          "uom": "B",
          "min": null,
          "max": null,
          "warning": null,
          "critical": null,
          "error": null,
          "percentile": null,
          "operator": null,
          "color_index": 1
        },
        {
          "label": "upbw",
          "measurement": "check_cpe",
          "metric": "upbw",
          "uom": "B",
          "min": null,
          "max": null,
          "warning": null,
          "critical": null,
          "error": null,
          "percentile": null,
          "operator": null,
          "color_index": 2
        }
      ]
    }
  ]
}
Query host service graphs types
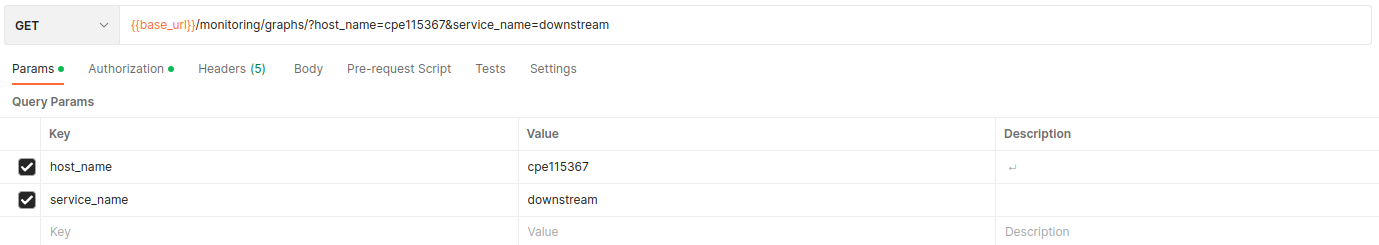
Method: GET
URL: /api/v2/monitoring/graphs/?host_name={internal_id|host_name}&service_name={service_name}
Note: The internal_id field is found within the attributes returned by the previous request. The host name can also be used in case of being a core host.
Response (Sample: /api/v2/monitoring/graphs/?host_name=pim0585&service_name=txrx):
{
  "graphs": [
    {
      "group": "dnatt Graph.",
      "severity": 50,
      "title": "dnatt Graph.",
      "type": "LineChart",
      "weight": 1,
      "range": "24h",
      "datasets": [
        {
          "label": "dnatt",
          "measurement": "check_txrx",
          "metric": "dnatt",
          "uom": "null",
          "min": 1,
          "max": 1,
          "warning": 26,
          "critical": 46,
          "error": null,
          "percentile": null,
          "operator": null,
          "color_index": null
        }
      ]
    },
    {
      "group": "dnrx Graph.",
      "severity": 0,
      "title": "dnrx Graph.",
      "type": "LineChart",
      "weight": -2,
      "range": "24h",
      "datasets": [
        {
          "label": "dnrx",
          "measurement": "check_txrx",
          "metric": "dnrx",
          "uom": "null",
          "min": -49,
          "max": -49,
          "warning": -11,
          "critical": -8,
          "error": null,
          "percentile": null,
          "operator": null,
          "color_index": null
        }
      ]
    },
    {
      "group": "uptx Graph.",
      "severity": 0,
      "title": "uptx Graph.",
      "type": "LineChart",
      "weight": 0,
      "range": "24h",
      "datasets": [
        {
          "label": "uptx",
          "measurement": "check_txrx",
          "metric": "uptx",
          "uom": "null",
          "min": -10,
          "max": -10,
          "warning": 15,
          "critical": 16,
          "error": null,
          "percentile": null,
          "operator": null,
          "color_index": null
        }
      ]
    },
    {
      "group": "uprx Graph.",
      "severity": 0,
      "title": "uprx Graph.",
      "type": "LineChart",
      "weight": -1,
      "range": "24h",
      "datasets": [
        {
          "label": "uprx",
          "measurement": "check_txrx",
          "metric": "uprx",
          "uom": "null",
          "min": -49,
          "max": -49,
          "warning": -12,
          "critical": -9,
          "error": null,
          "percentile": null,
          "operator": null,
          "color_index": null
        }
      ]
    },
    {
      "group": "upatt Graph.",
      "severity": 0,
      "title": "upatt Graph.",
      "type": "LineChart",
      "weight": 1,
      "range": "24h",
      "datasets": [
        {
          "label": "upatt",
          "measurement": "check_txrx",
          "metric": "upatt",
          "uom": "null",
          "min": 1,
          "max": 1,
          "warning": 26,
          "critical": 46,
          "error": null,
          "percentile": null,
          "operator": null,
          "color_index": null
        }
      ]
    },
    {
      "group": "pondesv Graph.",
      "severity": 0,
      "title": "pondesv Graph.",
      "type": "LineChart",
      "weight": 0,
      "range": "24h",
      "datasets": [
        {
          "label": "pondesv",
          "measurement": "check_txrx",
          "metric": "pondesv",
          "uom": "null",
          "min": -10,
          "max": -10,
          "warning": 2,
          "critical": 4,
          "error": null,
          "percentile": null,
          "operator": null,
          "color_index": null
        }
      ]
    }
  ]
}
Query specific graphs metrics in a time period
For each graph returned in the previous endpoint, you can request the metrics within a certain time interval for the different datasets.
If there are several datasets available for a graph, they can be requested simultaneously.
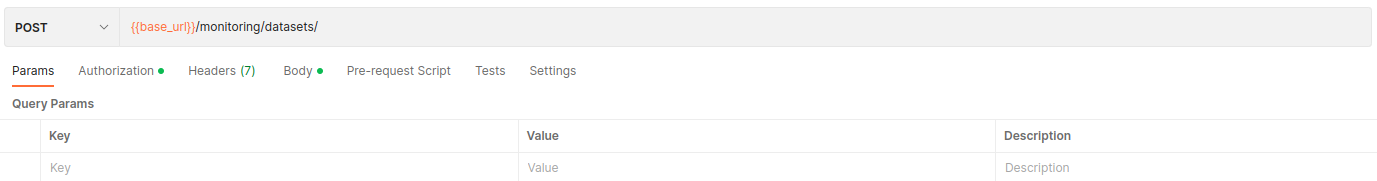
Method: POST
URL: /api/v2/monitoring/datasets/
Request:
{
  "host_name":"{internal_id|host_name}",
  "service_name":null|"service_name"
  "start":"{time_magnitude}",
  "end":"{time_magnitude}",
  "metrics":[
    {
      "host_name":"{internal_id|host_name}",
      "service_name":null|"{service_name}",
      "measurement":"{measurement}",
      "metric":"dnatt"
    }
  ],
}
time_magnitude: Composite value of units and magnitude of time, per Sample: 24h for the last 24 hours. The allowed magnitudes are: [m]minutes, [h]hours, [d]ays measurement: Extracted from the array of datasets from the graph request. metric: Extracted from the array of datasets from the graph request.
Sample request:
{
  "host_name":"pim0585",
  "service_name":"txrx"
  "start":"24h",
  "end":"0m",
  "metrics":[
    {
      "host_name":"pim0585",
      "service_name":"txrx",
      "measurement":"check_txrx",
      "metric":"dnatt"
    }
  ],
}
Response:
{
  "check_txrx__pim0585__txrx__dnatt":[
    {
      "time":"2023-02-16T15:00:00Z",
      "value":29.03,
      "unit":null
    },
    {
      "time":"2023-02-16T19:00:00Z",
      "value":30.35,
      "unit":null
    },
    {
      "time":"2023-02-16T23:00:00Z",
      "value":30.21,
      "unit":null
    },
    {
      "time":"2023-02-17T03:00:00Z",
      "value":31.54,
      "unit":null
    },
    {
      "time":"2023-02-17T07:00:00Z",
      "value":31.52,
      "unit":null
    },
    {
      "time":"2023-02-17T11:00:00Z",
      "value":27.03,
      "unit":null
    }
  ]
}