Dashboard
When the user logs in for the first time in the interface a window like the following is shown:
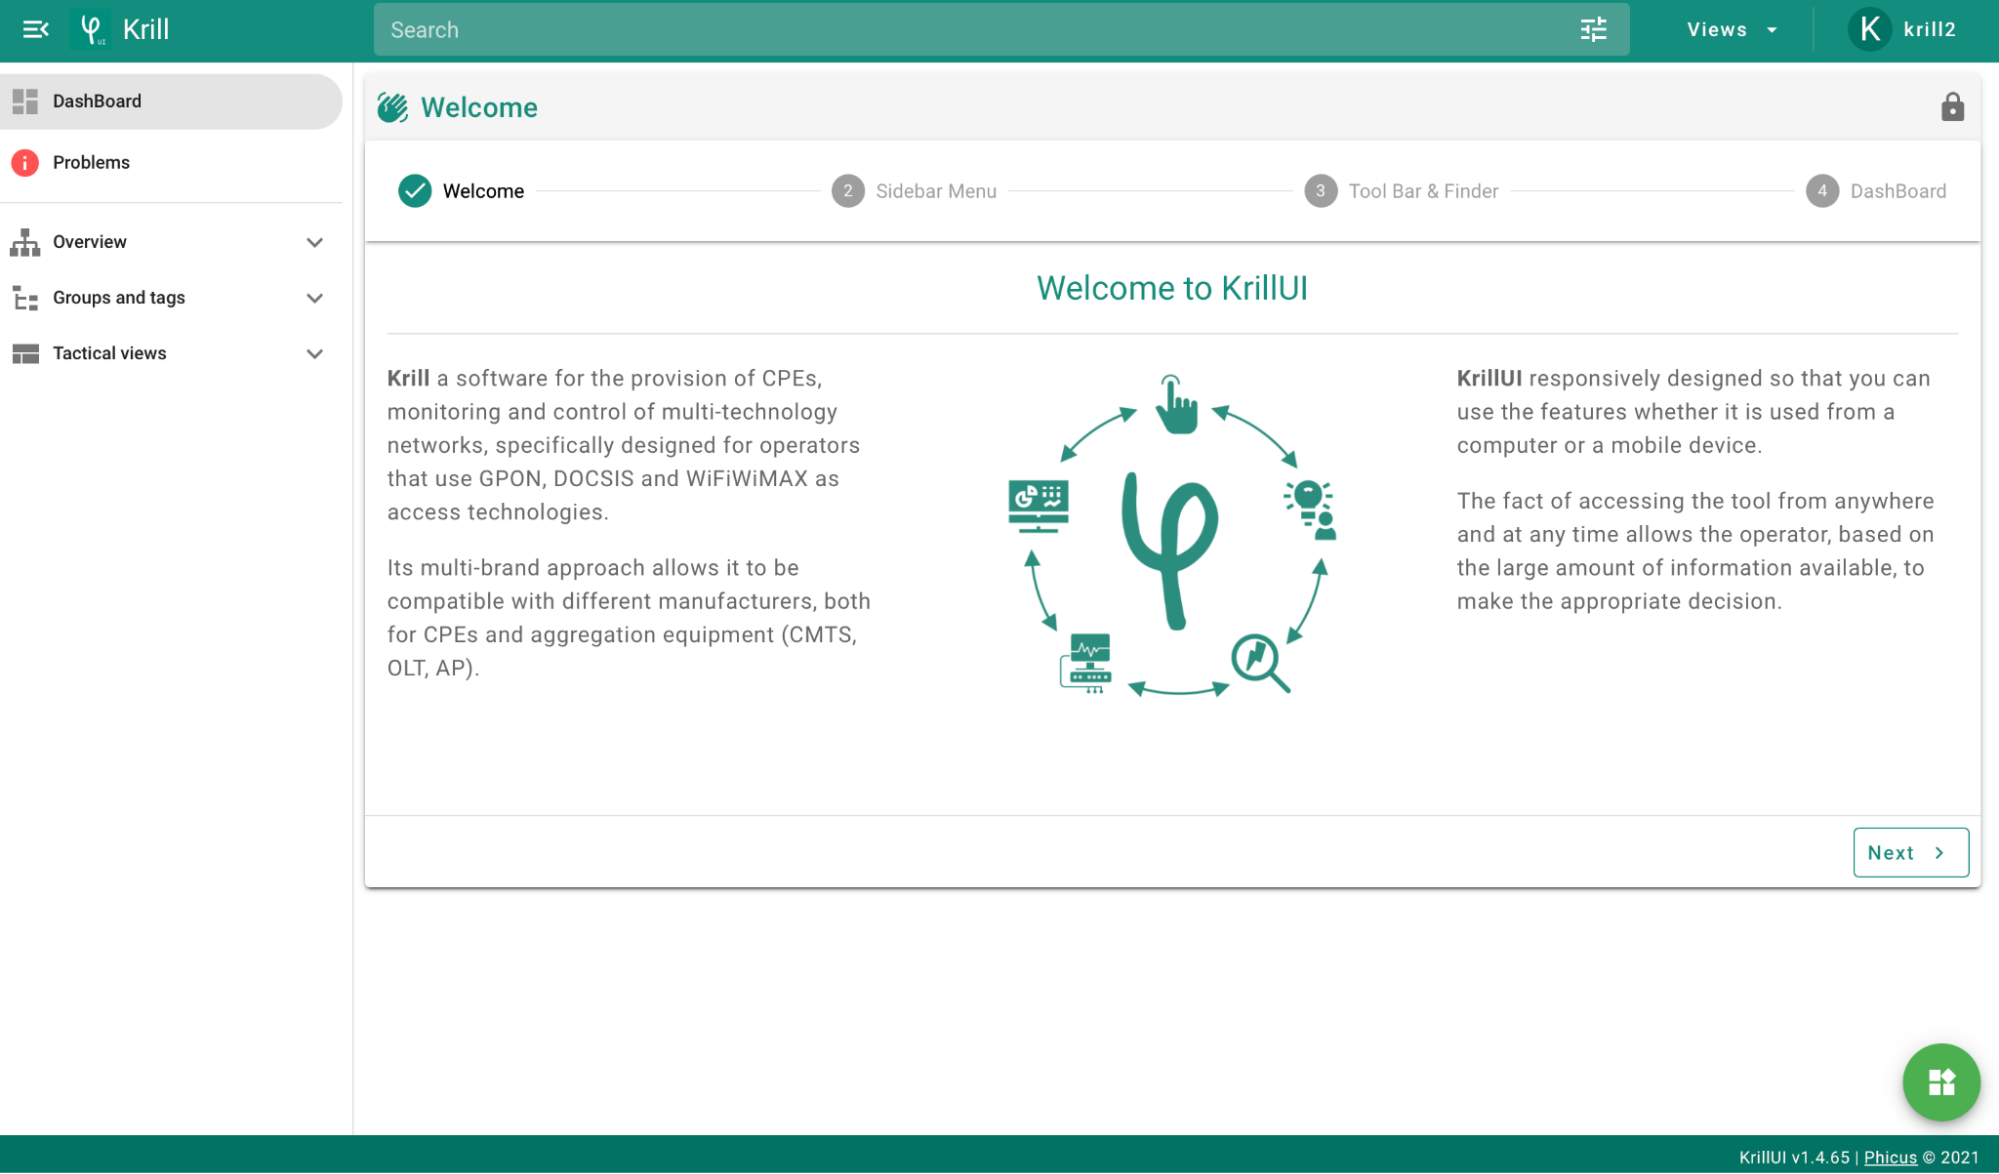
Here we can also find some elements that will appear in the rest of Krill2's pages.
Dashboards
KrillUI's main page can be customized with different Widgets, they will allow to see the network's general condition, the hosts and services' more critical incidents, the monitorization sistem's health condition, etc.
We can have as many dashboards as we like, and each of them can have different widgets to have them in order.
To create new dashboards, we are going to click on the 3 dots icon that appear at the top in the right, pressing on 'edit dashboard' it will allow us to Create a dashboard, Rename the dashboard, or Delete the dashboard.
Widgets
The first widget that is shown is the welcome one, it offers the user a little KrillUI's use guide.
TIP
Then more widgets can be added to give the screen more functions.
To add a widget, once we are in the dashboard's edition mode, we can do it from the button at the botton on the right of the page, by clicking the one we are interested in. The widget is going to be added in the first free space that it detects on the screen.
To move or change the size of a widget we must first click on the padlock icon that appears on its header(). After that, a button is going to be available next to its title. (), it will allow us to move it, and other at the right bottom corner will allow us to change its size().
To delete a widget, once it is unlocked, we should click on the trash can button that appears at the right of the header.
After finishing the "guide" and adding widgets we find the dashboard with the chosen widgets or the default ones. 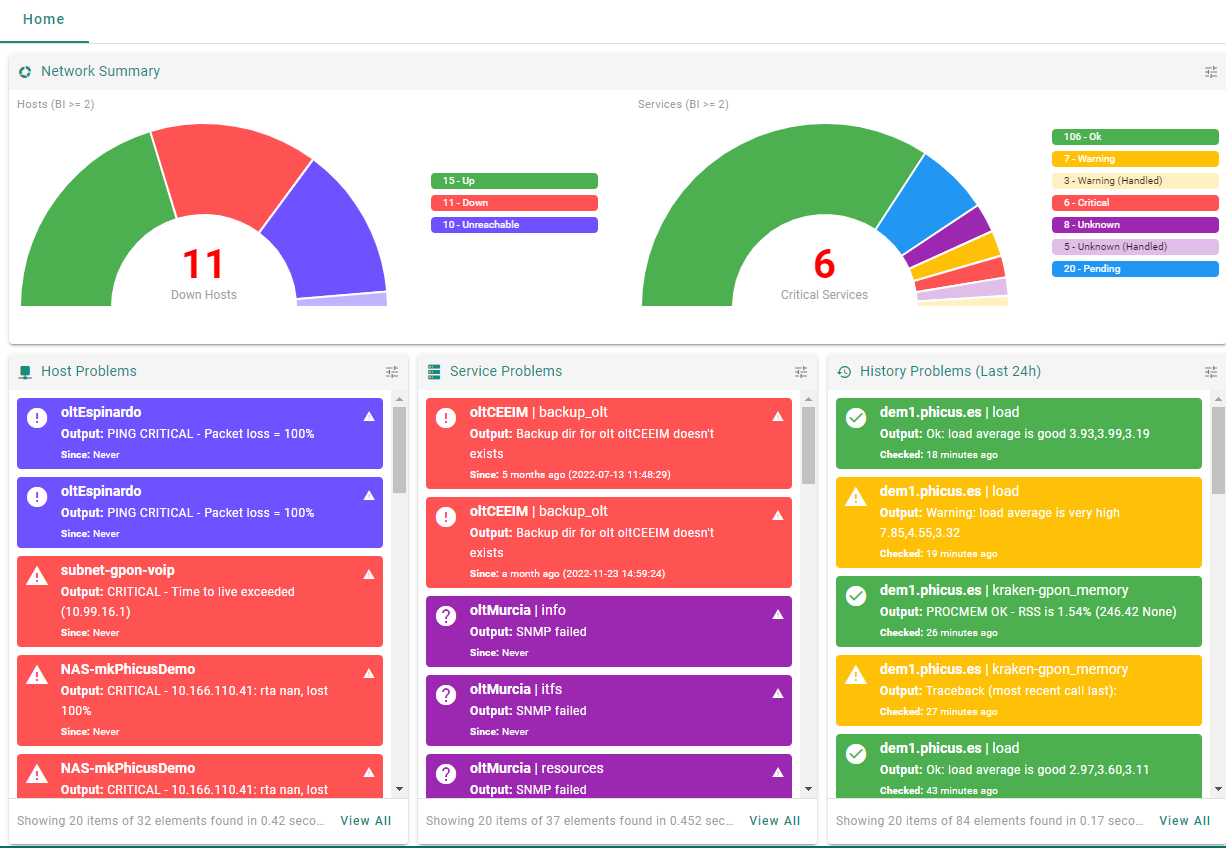
Algunos widgets son:
- Resumen de la red: Colored graph by sectors that gives updated information on the network's condition regarding Hosts and Services and differentiating its conditions.
- Hosts' problems: List of the problems related to hosts that affects the network more ordered by criticality.
- Services' problems: List of the problems related to services that affects the network more ordered by criticality.
- Historial de problemas: List of problems registered by Krill in the last 24 hours.
Tool bar and local search

In green, it has the local searcher for each module. At the right it also have a dropdown with the views and gives us access to the user's menu.
The searcher allows to search in the local view, if it is allowed, or in the main view of the Krill's active module. For example, if we are on a CPE's file, and we make a search, it is going to show us a list of services and devices that match the search criteria.
TIP
In the searcher we also have access to the saved as favorite searches, we can add as many of them as we like clicking on the bookmark that appears at the right of the search.
At the same time, it will show us the last 10 searches that have been done so we can access them quicker.
User's menu
It shows first which user are we logged in with, beneath that it shows the Krill's applications/modules. The modules the user sees are based on the permissions the logged in user has.
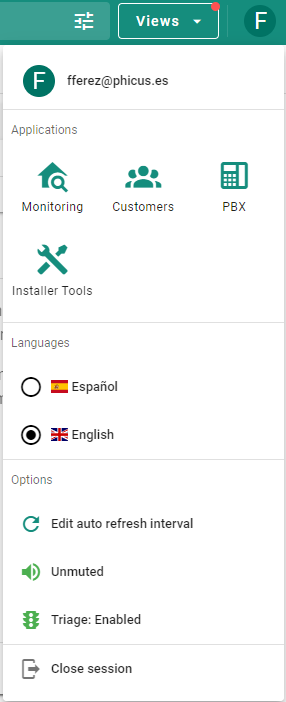
In this menu we can change between modules. The modules available today are:
- Monitoring: Monitorization of the network's devices and services
- Customers/ISP: Cutomers and CPEs' management
- PBX: PBX management
- Radius/Oratio: PPPoE session and IPs' pool control
- Installer tools: Installer tools
- Rubik: Tool for managing networks mutualized with other operators
- Logger: Log reports from API and Admin panel
- NAP/CTO Management: Inventory tool passive network
From this menu we can change Krill's language.
It allows to choose the web's self-refresh time, mute the Krill's alert sounds or activate/deactivate the triage mode.
Here you can also unlog your session.
Lateral menu and main search engine
The lateral panel's menu includes shortcuts to view or files of interest.
In the first place, at the top is the main search engine.

The main search engine can link services and hosts in the seam search, making it possible to find a CPE by searhing anything related to them, administrative or technical information.
TIP
New sections are going to be incorporated where searches that allows to find results in any of the modules we have access can be done.
Here are the menus that change according to the module we are using.A continuación los menús que cambian según el módulo que hagamos uso.
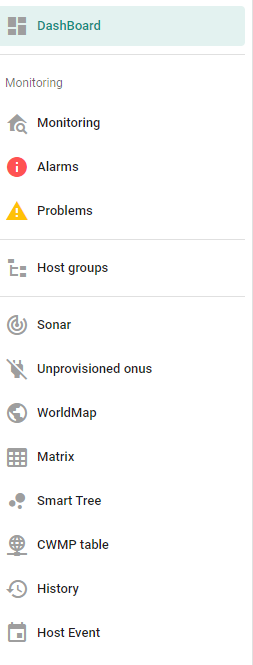
In the monitorization module, for example, it gives a shortcut to the alarms and the network's problems, as well as to the different host groups.
The Tactical View that allows us to view and organize the information on different network's elements: Matrix, Trivial, pending provition ONUs, sessiones Radius, etc, can also be accessed.