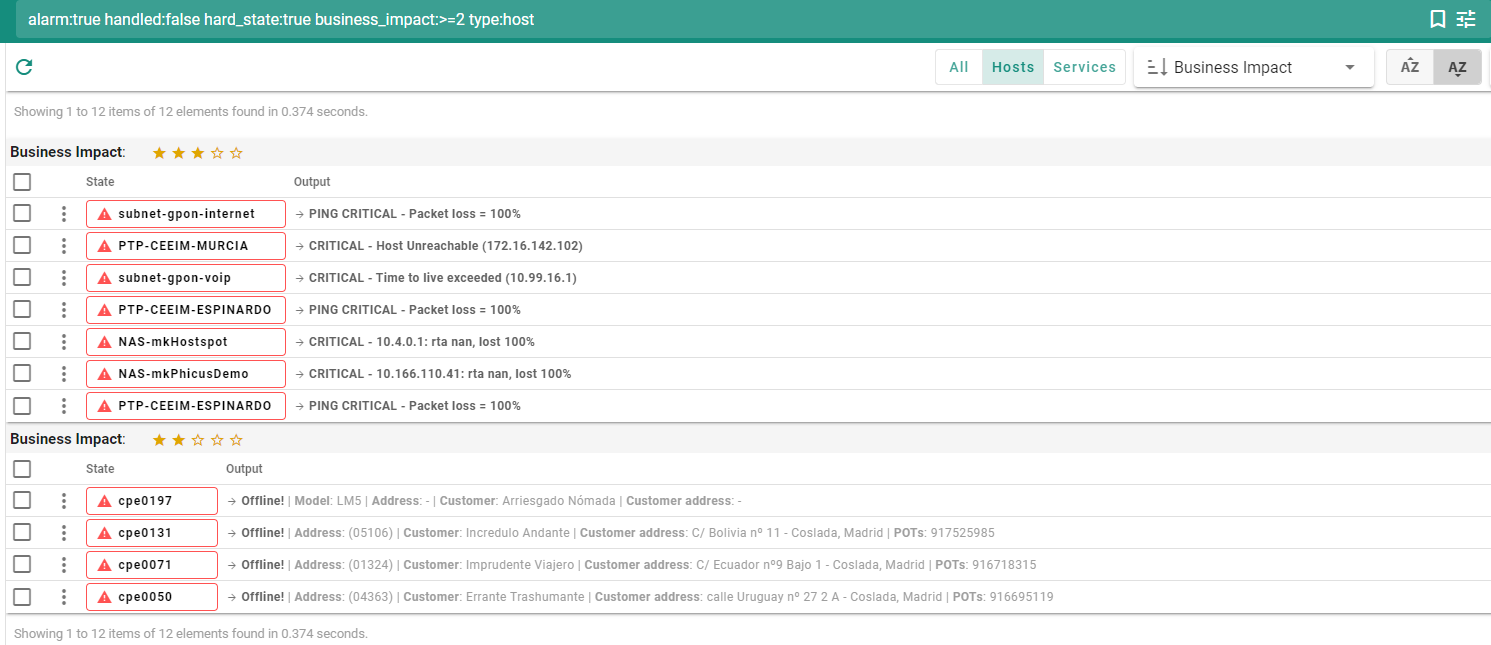
Krill User GuideKrill User Guide
Home
  • Login
  • Create users
  • Users
  • Dashboard
  • Modules

    • Monitoring
    • Customers/ISP
    • PBX
    • Radius
    • Rubik
    • Installer tools
    • Logger
    • Admin
  • API (V2)
  • Rubik API
  • Postman Samples
  • Widgets
ISP-CLI
  • 🇬🇧 English
  • 🇪🇸 Spanish
Home
  • Login
  • Create users
  • Users
  • Dashboard
  • Modules

    • Monitoring
    • Customers/ISP
    • PBX
    • Radius
    • Rubik
    • Installer tools
    • Logger
    • Admin
  • API (V2)
  • Rubik API
  • Postman Samples
  • Widgets
ISP-CLI
  • 🇬🇧 English
  • 🇪🇸 Spanish
  • Monitoring

    • Alarms
    • Problems
    • Matrix
    • Host Groups
    • Sonar
    • Unprovisioned Onus
    • Worldmap
    • Smart Tree
    • CWMP Table
    • Host Events
    • History
    • Host
    • CPE

Monitoring | Alarms

Predefined search that returns the network's alarms generated by Krill ordered by the affectation level from the more to the least important.

MonitoringAlarms

TIP

In the case of the Hosts it is considered alarm when they are DOWN and in the cae of serviceswhen their condition is CRITICAL.

The first search that will appear in the search bar on top will filter the results that are already under control (they have an ACK or Downtime), the ones whose condition is considered HARD and whose business impact is greater than 2 or equal:

alarm:true handled:false hard_state:true business_impact:>=2 type:all

At the top of the page we can select between Hosts and services with the selector that appears there. There's also another selector that allows us to change the result grouping rules by: Buisiness Impact, condition y host.

Last Updated:
Prev
Monitoring
Next
Monitoring | Problems