Krill User GuideKrill User Guide
Home
  • Login
  • Create users
  • Users
  • Dashboard
  • Modules

    • Monitoring
    • Customers/ISP
    • PBX
    • Radius
    • Rubik
    • Installer tools
    • Logger
    • Admin
  • API (V2)
  • Rubik API
  • Postman Samples
  • Widgets
ISP-CLI
  • 🇬🇧 English
  • 🇪🇸 Spanish
Home
  • Login
  • Create users
  • Users
  • Dashboard
  • Modules

    • Monitoring
    • Customers/ISP
    • PBX
    • Radius
    • Rubik
    • Installer tools
    • Logger
    • Admin
  • API (V2)
  • Rubik API
  • Postman Samples
  • Widgets
ISP-CLI
  • 🇬🇧 English
  • 🇪🇸 Spanish
  • Monitoring

    • Alarms
    • Problems
    • Matrix
    • Host Groups
    • Sonar
    • Unprovisioned Onus
    • Worldmap
    • Smart Tree
    • CWMP Table
    • Host Events
    • History
    • Host
    • CPE

Monitoring | Host Groups

This view groups all the kind of hosts that are registered in Krill, they are differentiated by their condition and its color depends on the condition too.

MonitoringHostGroups

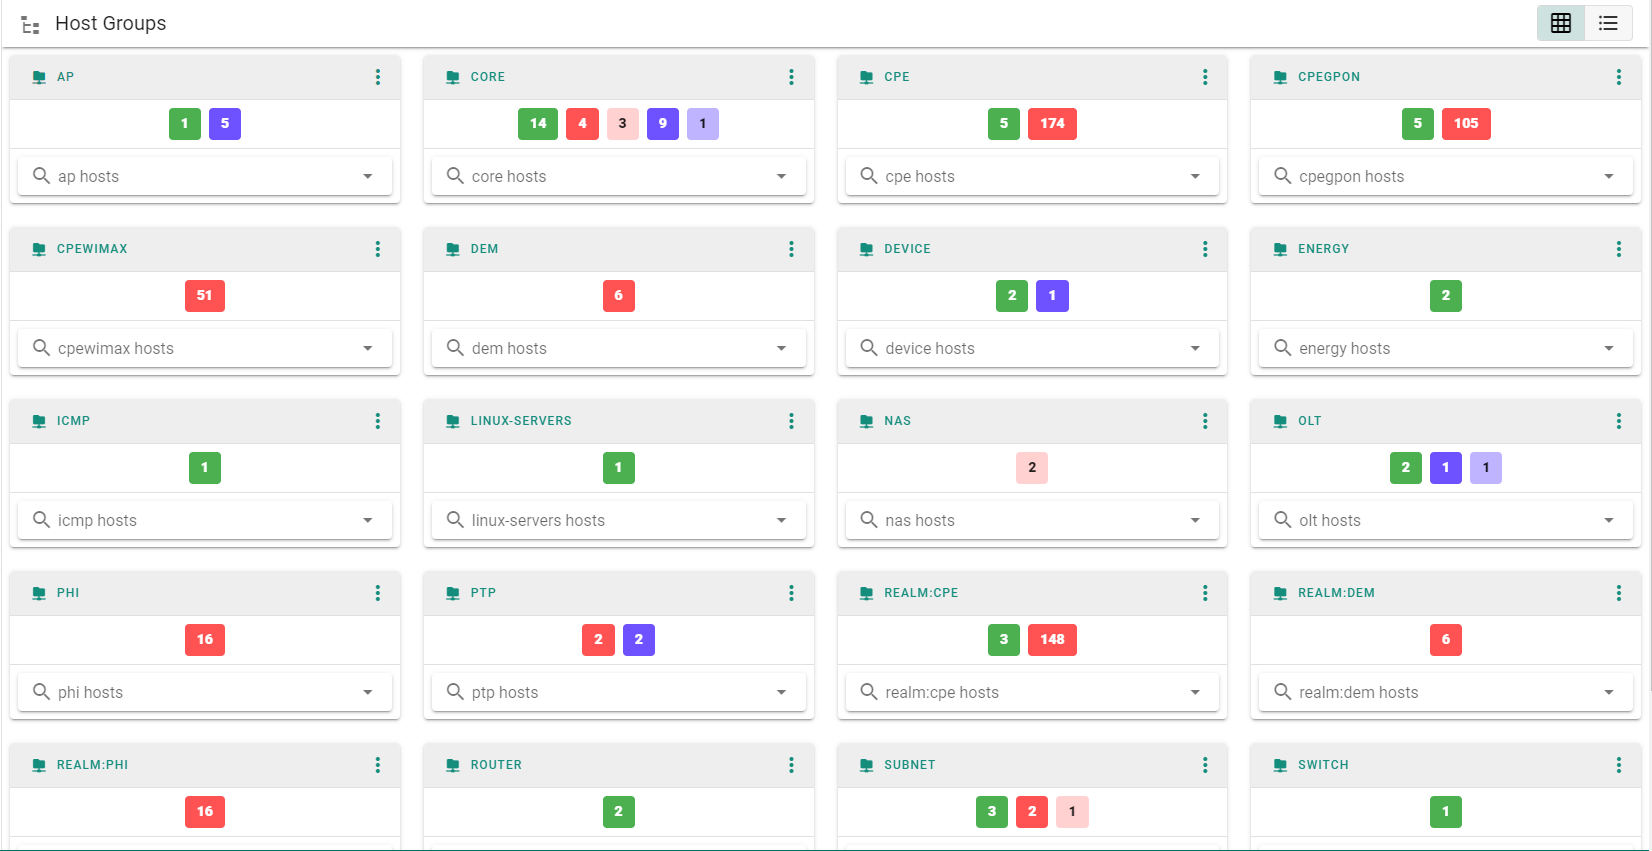
It is useful to look at the different network's devices condition quickly.

TIP

The different conditions according to their color are:

  • Green: it means they are ok/reachable.
  • Red: they have some problem or are down.
  • Orange: some service is alarmed.
  • Blue: the device has not been checked and is in an unknown condition.
  • Purple: the service or host is unreachable.

If the color is light it indicates that the device or service is under control with an ACK or Downtime.

Here the network's OLTs, routers, or servers that Krill monitors, among others are listed.

Each Host Group has a direct link to its search that makes the access to its list easier by just clicking on them.

Last Updated:
Prev
Monitoring | Matrix
Next
Monitoring | Sonar